Official purchases and the bond yield conundrum
More on:
Actually, the title really should be official purchases, data revisions and the bond yield conundrum. This is a rather wonky post.
The Economist View highlighted a paper by Tao Wu of the Federal Reserve Bank of Dallas (and a coauthor of Rudebusch, Swanson and Wu) that cast doubt on the impact of foreign official demand on Treasury yields.
Tao Wu’s Chart 3 in particular caught my eye. According to the data presented, official purchases (or Treasuries) fell sharply after 2004, but bond yields remained low. The conundrum out-lasted official demand.
That -- together with some econometric work that failed to find the expected relationship between official demand and treasury yields (or rather only found the expected relationship after 2000) -- casts a bit of doubt on my preferred explanation for low US rates over the past several years. It also is a conclusion at odds with Warnock and Warnock.
Perhaps as importantly, the sharp fall in official demand for Treasuries in graph 3 didn’t match my sense of what has been happening. That called for a bit more investigation. I also wanted to look at whether one key difference between Rudebusch and Wu and Warnock and Warnock (updated here)-- namely that Warnock and Warnock look at official demand for Treasuries and Agencies not just official demand for Treasuries might explain the different conclusions. Some Agencies are fairly close substitutes for Treasuries.
My conclusions? To make a long story short, data revisions matter. The fall in official demand for Treasuries so apparent in Wu’s chart largely disappears if you look at the revised data (which is only available on a quarterly basis). Essentially, the shift in reserve growth from Japan, Korea and Taiwan to China, Brazil, India and the oil exporters reduced the share of official demand for Treasuries that appears in the monthly TIC data more than in reduced official demand for Treasuries.
The evidence?
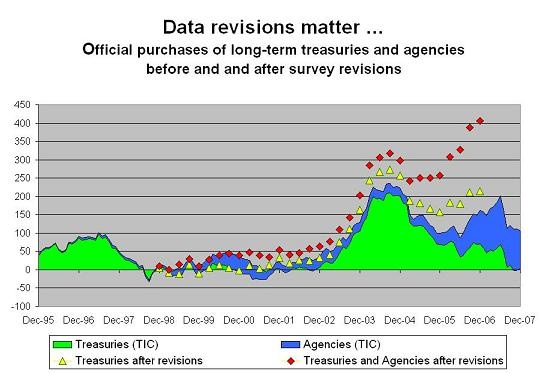
The following chart shows foreign official demand for Treasuries and Agencies (looking at the rolling 12m sum) in the TIC data and the revised totals in the BEA capital account data. The revisions are made to reflect the outcome of the annual survey of foreign portfolio holdings. The revised total for Treasuries is in yellow, and the red dots show the sum of Treasury and Agency purchases after the revisions.

The unrevised data comes from the Treasury (via Bloomberg) and the revised data comes from the BEA (use the interactive tables. Wu’s chart 3 is scaled to GDP, while I kept everything in dollars. That doesn’t change all that much.
What does the chart show?
First, the fall off in overall demand for Agencies and Treasuries essentially disappears in the revised data. Total official purchases go from a bit over $300b in 2004 to $250b in 2005, and then rise to $400b or so in 2006. There is a bit of a fall off in demand for Treasuries. There also was a fall in new issuance, as the US started running smaller deficits. Total Treasuries in private hands actually didn’t rise much -- but that is another story. More importantly, the fall in demand for Treasuries was offset by an increase in demand for Agencies.
Second, the size of the gap between the initial data and the revised data seems to be increasing over time. There is a fairly simple reason for this, which I already mentioned. Japanese purchases tend to show up in the data in real time (in the monthly TIC data), while Chinese purchases tend to show up with a lag (long-term Chinese purchases were revised up by around $90b after each of the last two surveys). Russian purchases also tend to be revised up. The Gulf’s purchases in general just don’t show up -- so even the revised data likely undercounts total official purchases, or at least the purchase of dollar-denominated securities with government funds. The Gulf uses outside fund managers more than China or Russia.
The last revised data point is for December 2006 (the BEA tends to smooth the data, increasing purchases before and after the June survey rather than just having a big one-off jump). What has been happening since then?
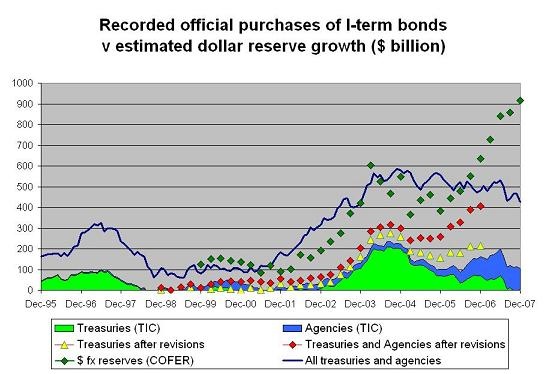
To make an informed guess, I added two lines to the earlier chart -- one that shows total foreign purchases of long-term Treasuries and Agencies, and one that shows my estimate for dollar reserve growth globally. The resulting chart is a bit confusing, but hopefully still comprehensible.

What does it show?
First, in 2006, official purchases accounted for nearly all total foreign purchases of Treasuries and Agencies. The red dots converge with the blue line. That only became apparent though after the post-survey data revisions.
Second, overall reserve growth is far stronger now than in 2006, so one would expect more official demand for all official assets. The fall in total official purchases doesn’t make much sense. It likely will change with the data revisions.
Third, official demand has shifted toward Agencies and away from Treasuries. That basic trend is real and in my judgment won’t change with the data revisions. 2008 though may offer a different story. Agencies haven’t performed so well recently.
Fourth, total foreign purchases of Treasuries and Agencies (the blue line) hasn’t increased along with the increase in reserve growth. That tells us less than you might think. The US only tracks the sale of US debt from US residents to foreigners, not sales among non-residents. So if in 2007 the PBoC bought a Treasury bond purchased by a German pension fund in 2005 it wouldn’t show up in the US data for 2007 at all. Because of such transactions, the increase in official holdings could exceed total foreign purchases. But the absence of a strong correlation between overall purchases of Treasuries and Agencies and overall reserve growth still is interesting -- it certainly is different from 2002-2004.
So where have the funds that haven’t gone into Treasuries and Agencies gone?
It doesn’t seem to have gone into the equity market. Foreign purchases of equities haven’t really increased that much -- and, at around $200b a year, are still quite small relative to total bond purchases.
Some of it has gone into short-term deposits and bills -- which aren’t included in the data here. The US data shows a $100b increase in short-term official claims.
Some of it may be in offshore dollar deposits, or the BIS.
Some may have gone into dollar debt issued by say European companies or emerging markets themselves (though I suspect this is small).
Some may have gone into other currencies, as central banks diversified -- though the data from the emerging market central banks that report to the IMF doesn’t suggest much diversification. The (small) fall in the dollar’s overall share reflects the fact that the reserves of reporting emerging economies (which keep about 60% of their reserves in dollars) are growing faster than the reserves of the industrial economies, which have a big dollar share -- not a shift in the portfolio composition of reporting emerging economies.
And the IMF data only tells us so much -- the big Gulf central banks and China don’t report data on the currency composition of their reserves to the IMF.
The gap between overall Treasury and Agency purchases and overall reserve growth over the past year remains a bit of a mystery to me.
But one thing seems fairly certain. The gap between official purchases in the TIC data and actual official purchases that developed in 2005 and grew in 2006 almost certainly continued to rise in 2007. That suggests, at least to me, that any econometric work based off the unrevised TIC data also may need to be revised -- or at least updated using the revised data.
That though is technically hard, since the TIC data is monthly and the revised data is quarterly. There are a lot fewer observations. But given how big the gap is between the unrevised data and the revised data, I suspect using unrevised data produces an equally misleading picture.
One final point: the Fed’s custodial holdings increased by around $30b in February. That is a bit off the torrid January pace, but it is still very strong. Sovereign wealth funds may still be buying banks not bills now, but demand for plain old Treasury and Agency bonds hasn’t gone away.
More on:
 Online Store
