 Online Store
International efforts, such as the Paris Agreement, aim to reduce greenhouse gas emissions. But experts say countries aren’t doing enough to limit dangerous global warming.

Drilling into the American Energy Boom, in Four Charts
More on:
One interesting feature of the U.S. hydrocarbon boom is the widening gap between the industry’s interest in drilling for oil and other liquids versus dry natural gas. It’s all about economics: the disparity in prevailing market prices and outlook between these commodities is dictating companies’ willingness to sink money into, and bear the risk of, trying to produce them.
The two graphs below show industry expenditures on exploration and production (E&P) in North America relative to crude oil and natural gas prices, courtesy of the U.S. oil services and drilling equity research team at Barclays Capital. Surging prices for both goods starting around 2003 sparked a boom in spending, which roughly tripled between 2002 and 2012.
Figures 1 and 2: North American E&P spending vs. benchmark U.S. crude oil and natural gas prices
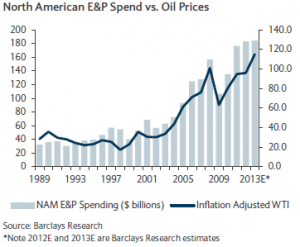
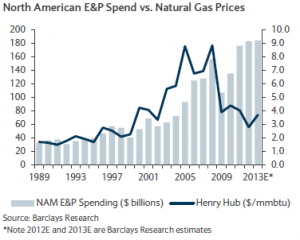
As the two figures show, the surge in gas production from the investment boom helped swamp benchmark natural gas prices at Henry Hub, Louisiana, reflecting a glutted market. Benchmark West Texas Intermediate (WTI) oil prices, in contrast, quickly rebounded to around triple-digits after their epic collapse in 2008-9, and remain far above long-term inflation-adjusted historical averages (despite having to contend with a glut of their own at the WTI pricing hub of Cushing, Oklahoma).
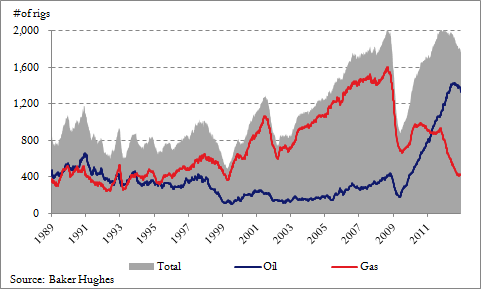
Looking at oil- versus gas-directed rotary rig counts in the United States makes it clear just how much more drilling activity is occurring here right now relative to the 1990s (Figure 3). There are about twice as many rigs deployed today as there were a decade ago. In absolute terms, drillers favored gas between 2002 and 2009, moving hundreds of rigs into production. But with natural gas prices down for the count, and with the rapid resurgence of the price of oil, North American operators are overwhelmingly choosing to channel their investment into the hunt for liquids.
Figure 3. Rotary rigs in operation in the United States since 1989 (including oil- vs. gas-directed)
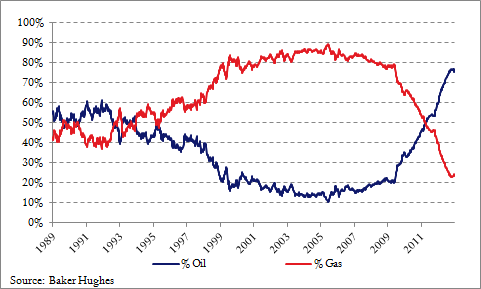
The substitution of gas for oil-directed drilling activity has been a defining reversal in U.S. hydrocarbon production over the last three years. Whereas just a few years ago nearly 90 percent of rigs were looking for dry gas, that figure’s plummeted to 24 percent—and oil-directed rigs now make up three-quarters of the total.
Figure 4. Percentage of oil- versus gas-directed rotary rigs in operation in the United States
This picture could change if gas prices were to move high enough to justify companies increasing their budgets for gas drilling again, which could set off a scramble for those contractors able to quickly get rigs back into gas plays. But for the time being, it’s oil, not dry gas, that operators are interested in, not surprisingly, given the price differential. Either way, the aggregate picture is of a country where drilling is at full tilt. Even Hollywood wants in on the action.
More on: